Blog

Abortion Trigger Bans

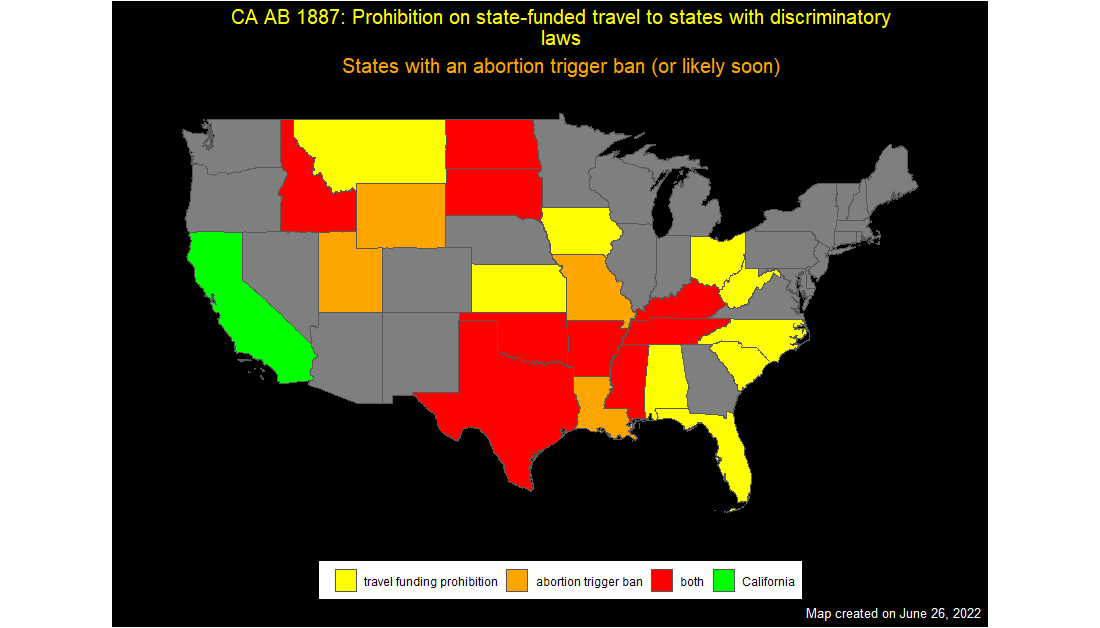
A colleague asked me about making an overlay map, and we discussed staring with the following information: US states where conference funding may be inhibited by AB 1887 US states where trigger bans took (or are in process) effect when Roe v Wade was overturned # load shape files states_shp <- st_read("cb_2018_us_state_5m/cb_2018_us_state_5m.shp") ## Reading layer `cb_2018_us_state_5m' from data source ## `C:\Users\freex\Documents\GitHub\blogdown\content\blog\2022-06-26-abortion-trigger-bans\cb_2018_us_state_5m\cb_2018_us_state_5m.shp' ## using driver `ESRI Shapefile' ## Simple feature collection with 56 features and 9 fields ## Geometry type: MULTIPOLYGON ## Dimension: XY ## Bounding box: xmin: -179.

Continue reading

Gauges

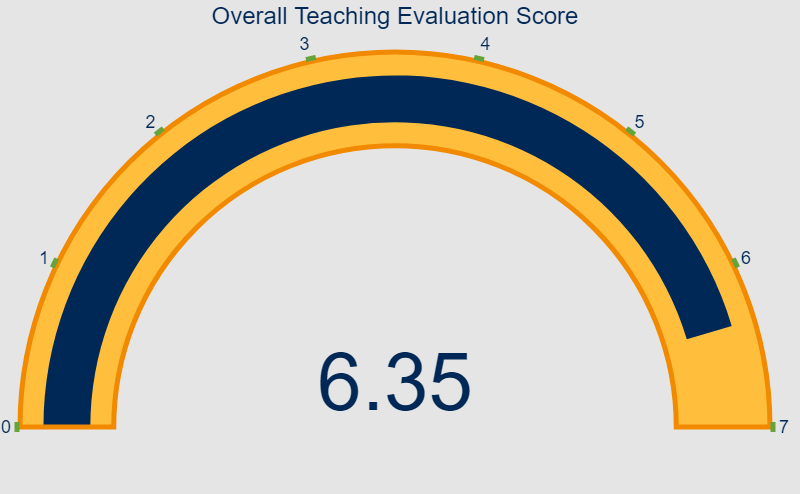
Gauges are useful when wanting to display a quantity along with its range (minimum and maximum). Here, we will try out the plotly package’s functionality to build a gauge plot. library("plotly") library("tidyverse") # https://plotly.com/r/gauge-charts/ # https://marketing.ucmerced.edu/resources/brand-guidelines/colors my_gauge <- plot_ly( domain = list(x = c(0, 1), y = c(0, 1)), value = 6.35, title = list(text = "Overall Teaching Evaluation Score", color = "#002856", font = list(size = 24)), type = "indicator", mode = "gauge+number", gauge = list( axis = list(range = list(NULL, 7.

Continue reading

Drought Conditions

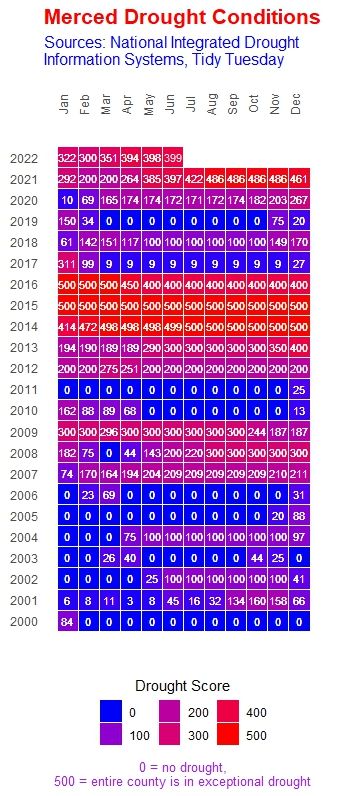
“The data this week comes from the National Integrated Drought Information System.” # load raw data # drought <- readr::read_csv('https://raw.githubusercontent.com/rfordatascience/tidytuesday/master/data/2022/2022-06-14/drought.csv') # drought_fips <- readr::read_csv('https://raw.githubusercontent.com/rfordatascience/tidytuesday/master/data/2022/2022-06-14/drought-fips.csv') # focus on subset of data # https://www.weather.gov/hnx/cafips # merced_df <- drought_fips |> # filter(FIPS == "06047") # since original data was a fairly large data file, let's # save a copy here to ease work # write_csv(merced_df, "merced_drought.csv") df_raw <- read_csv("merced_drought.csv") ## Rows: 1171 Columns: 4 ## ── Column specification ──────────────────────────────────────────────────────── ## Delimiter: "," ## chr (2): State, FIPS ## dbl (1): DSCI ## date (1): date ## ## ℹ Use `spec()` to retrieve the full column specification for this data.

Continue reading

Bookdown and GitHub Pages

Today I finally got a bookdown book to appear properly in GitHub pages (well, perhaps I did this in the past, but I do not recall). The main gap was that I needed to add the following line output_dir: docs to the _bookdown.yml file. Of course, the GitHub repository and Pages needed to be set up as well to point to the docs subdirectory. Here were the helpful websites

Continue reading

TidyTuesday 20220607

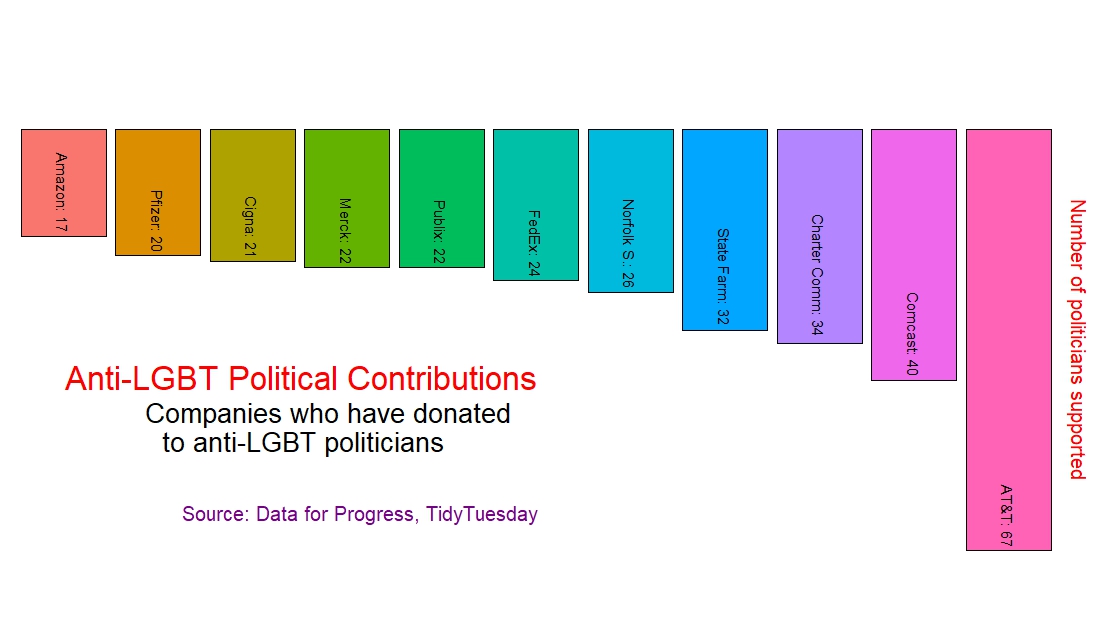
“The data this week comes from Data For Progress. “Each year, hundreds of corporations around the country participate in Pride, an annual celebration of the LGBTQ+ community’s history and progress. They present themselves as LGBTQ+ allies, but new research from Data for Progress finds that in between their yearly parade appearances, dozens of these corporations are giving to state politicians behind some of the most bigoted and harmful policies in over a decade.

Continue reading

Counting Political Mail

sender <- c("Steve Glaser", "Anna Caballero", "Esmeralda Soria", "Mike Karbassi", "Adam Gray", "CA Real Estate", "CFT", "misc") counts <- c(3, 3, 10, 6, 4, 4, 3, 1) df <- data.frame(sender, counts) df <- df |> mutate(for_label = paste0(sender, ": ", counts)) |> mutate(sender_ranked = forcats::fct_reorder(sender, counts)) df |> ggplot() + geom_bar(aes(x = counts, y = sender_ranked, fill = sender_ranked), stat = "identity") + geom_text(aes(x = counts, y = sender_ranked, label = for_label), hjust = "right", nudge_x = -0.

Continue reading

Trying out blastula

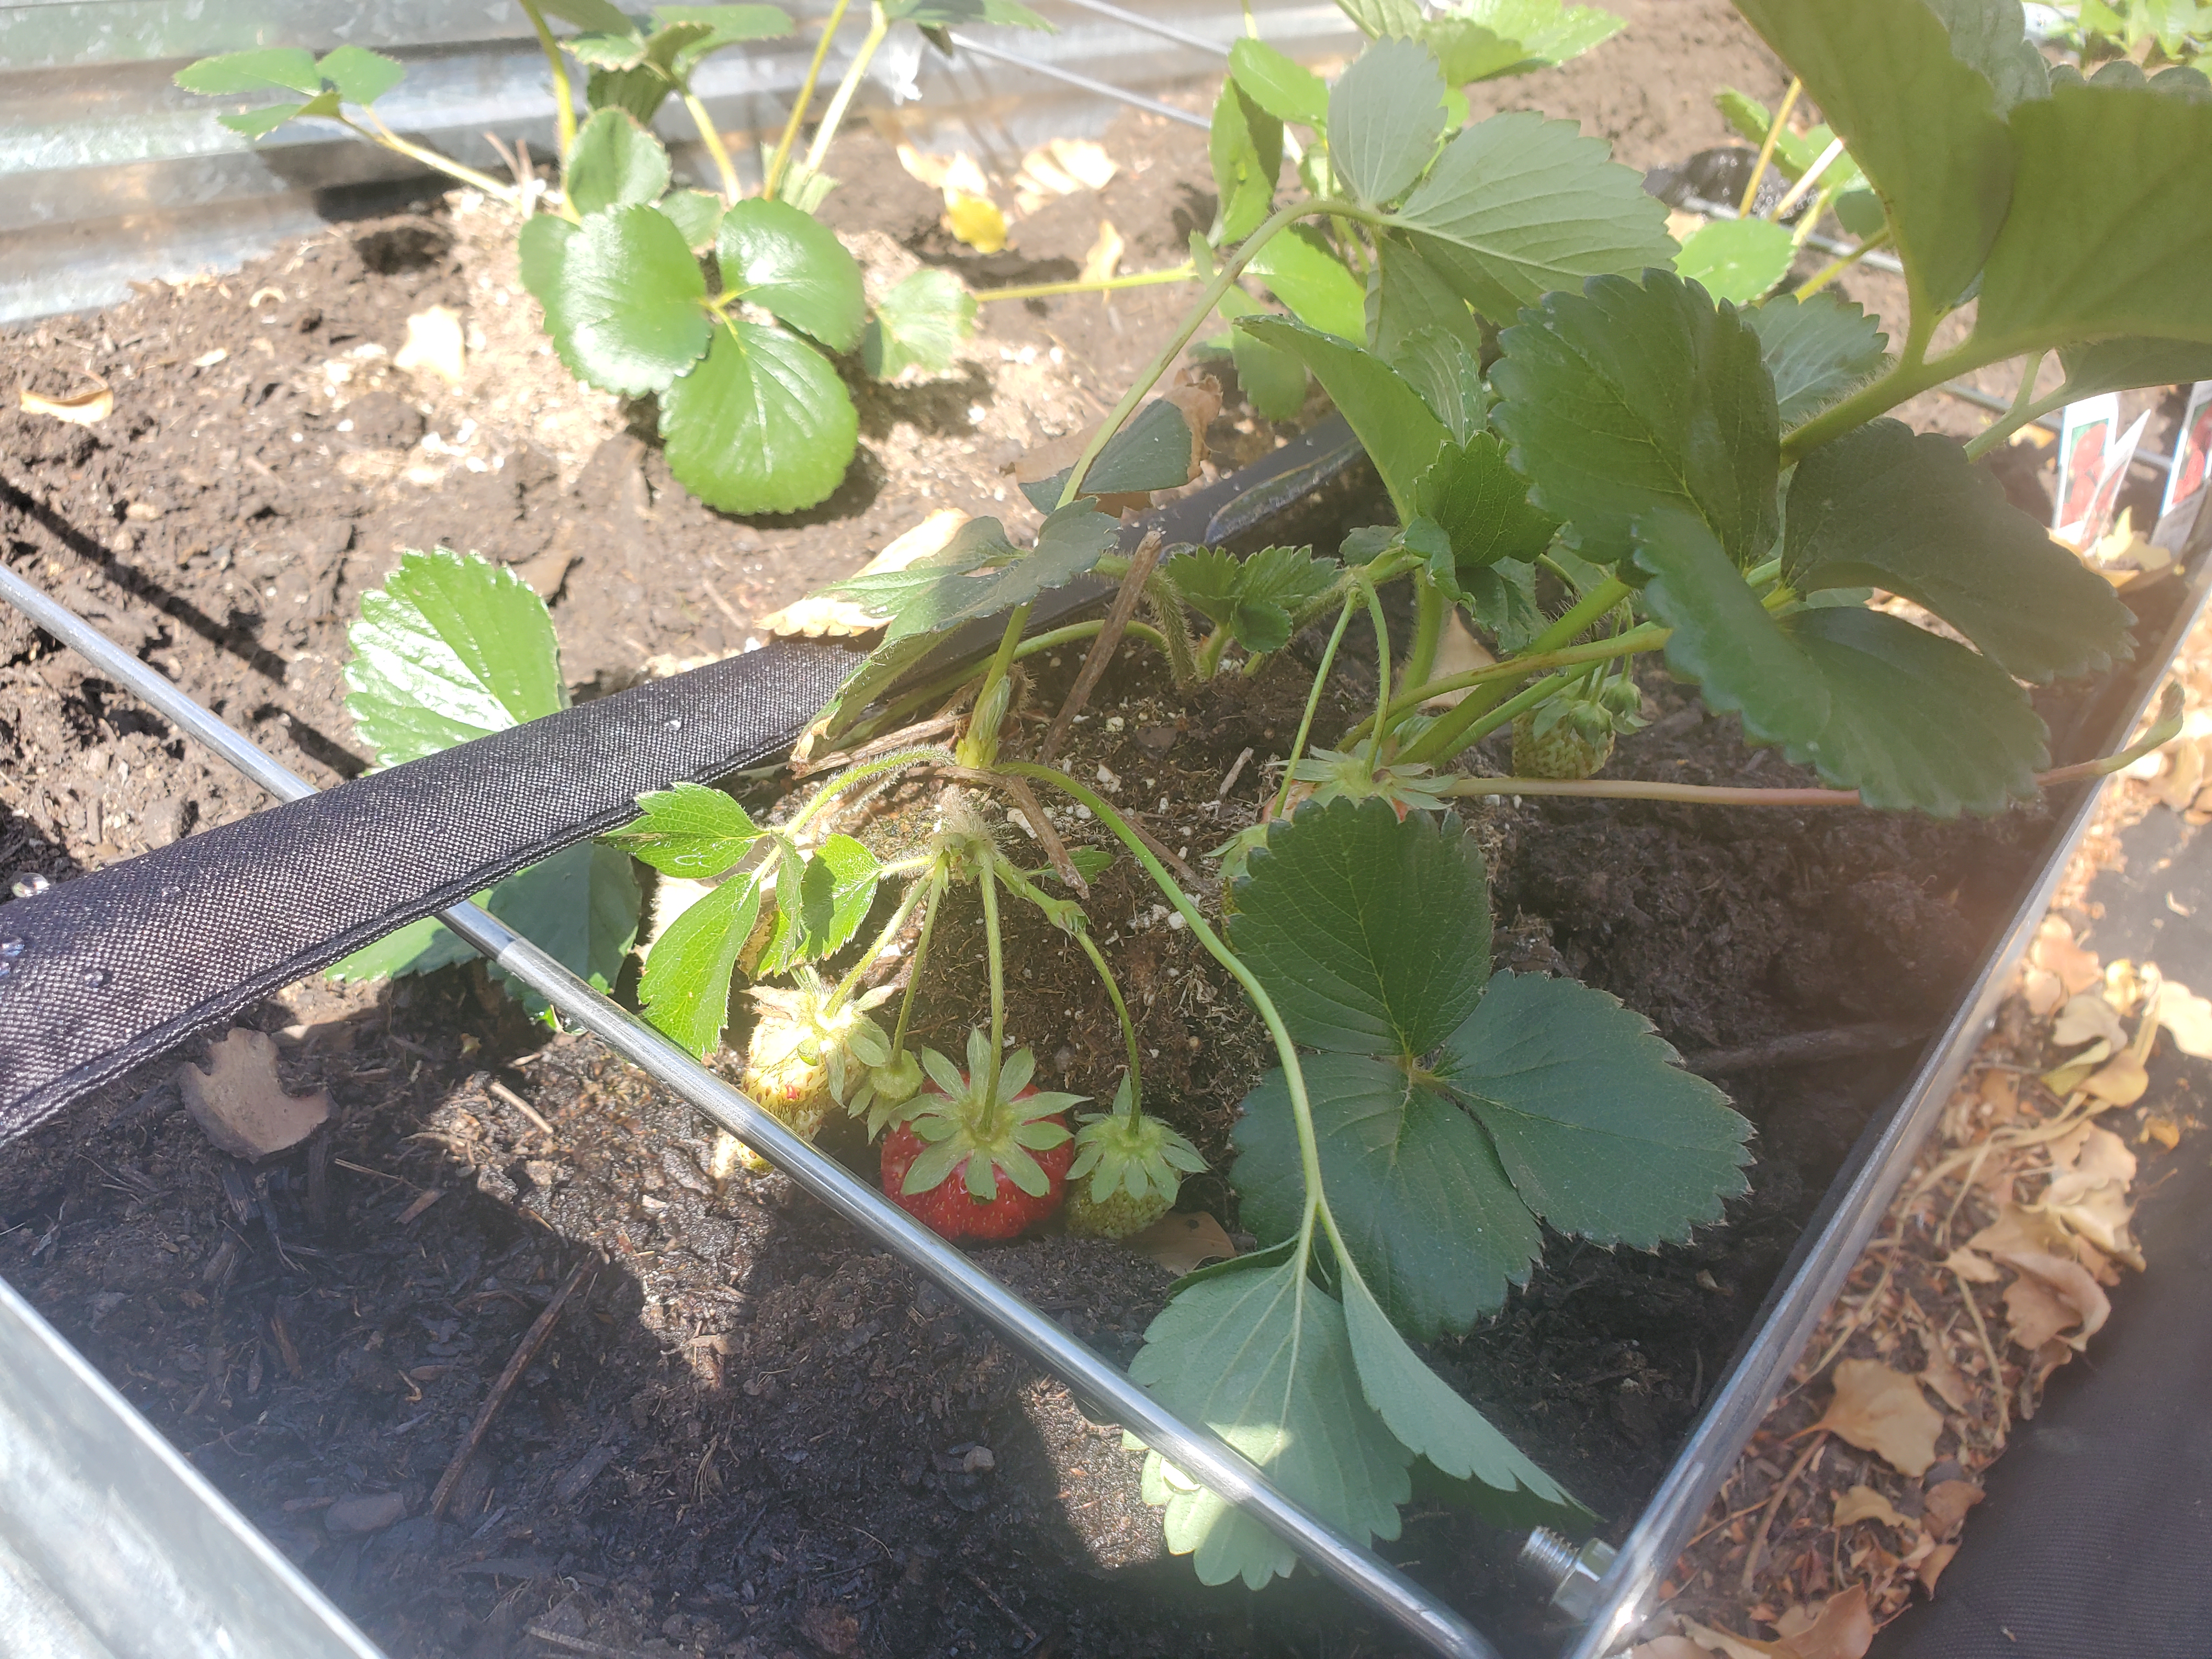
# vignette: https://github.com/rstudio/blastula # Get a nicely formatted date/time string current_date_time <- add_readable_time() image_string <- blastula::add_image("20220402_160706.jpg") newsletter <- blastula::compose_email( body = md( glue::glue( "Good Afternoon, This is a very early draft of a newsletter format that has been created with the R programming language using the `blastula` package. For now, here is a picture from my garden: {image_string} " )), footer = md( glue::glue( "Newsletter compiled on {current_date_time}" ) ) ) #print(newsletter)

Continue reading

Another Restart

Today I finally got around to trying to make another blogdown site. In the web searches, I found that I was not alone in having trouble using the academic theme, so I switched over to universal. I still wanted a complex theme where I could customize colors and widgets.

Continue reading