| August 10, 2022
I want to mentally prepare for the upcoming semester. Today, let me do a warm-up exercise of computing a Kruskal-Wallis test.
library("palmerpenguins")
library("tidyverse")
You can see that I will use the ubiquitous Palmer Penguins data set
str(penguins)## tibble [344 × 8] (S3: tbl_df/tbl/data.frame)
## $ species : Factor w/ 3 levels "Adelie","Chinstrap",..: 1 1 1 1 1 1 1 1 1 1 ...
## $ island : Factor w/ 3 levels "Biscoe","Dream",..: 3 3 3 3 3 3 3 3 3 3 ...
## $ bill_length_mm : num [1:344] 39.1 39.5 40.3 NA 36.7 39.3 38.9 39.2 34.1 42 ...
## $ bill_depth_mm : num [1:344] 18.7 17.4 18 NA 19.3 20.6 17.8 19.6 18.1 20.2 ...
## $ flipper_length_mm: int [1:344] 181 186 195 NA 193 190 181 195 193 190 ...
## $ body_mass_g : int [1:344] 3750 3800 3250 NA 3450 3650 3625 4675 3475 4250 ...
## $ sex : Factor w/ 2 levels "female","male": 2 1 1 NA 1 2 1 2 NA NA ...
## $ year : int [1:344] 2007 2007 2007 2007 2007 2007 2007 2007 2007 2007 ...Our null hypothesis will be that the three species of penguins have the same bill length. Let us first get a visual.
penguins |>
  ggplot() +
  geom_boxplot(aes(x = species, y = bill_length_mm,
                   fill = species)) +
  labs(title = "Palmer Penguins",
       subtitle = "null hypothesis: the three species of penguins have the *same* bill length",
       caption = "Derek Sollberger") +
  theme_minimal()
## Warning: Removed 2 rows containing non-finite values (stat_boxplot).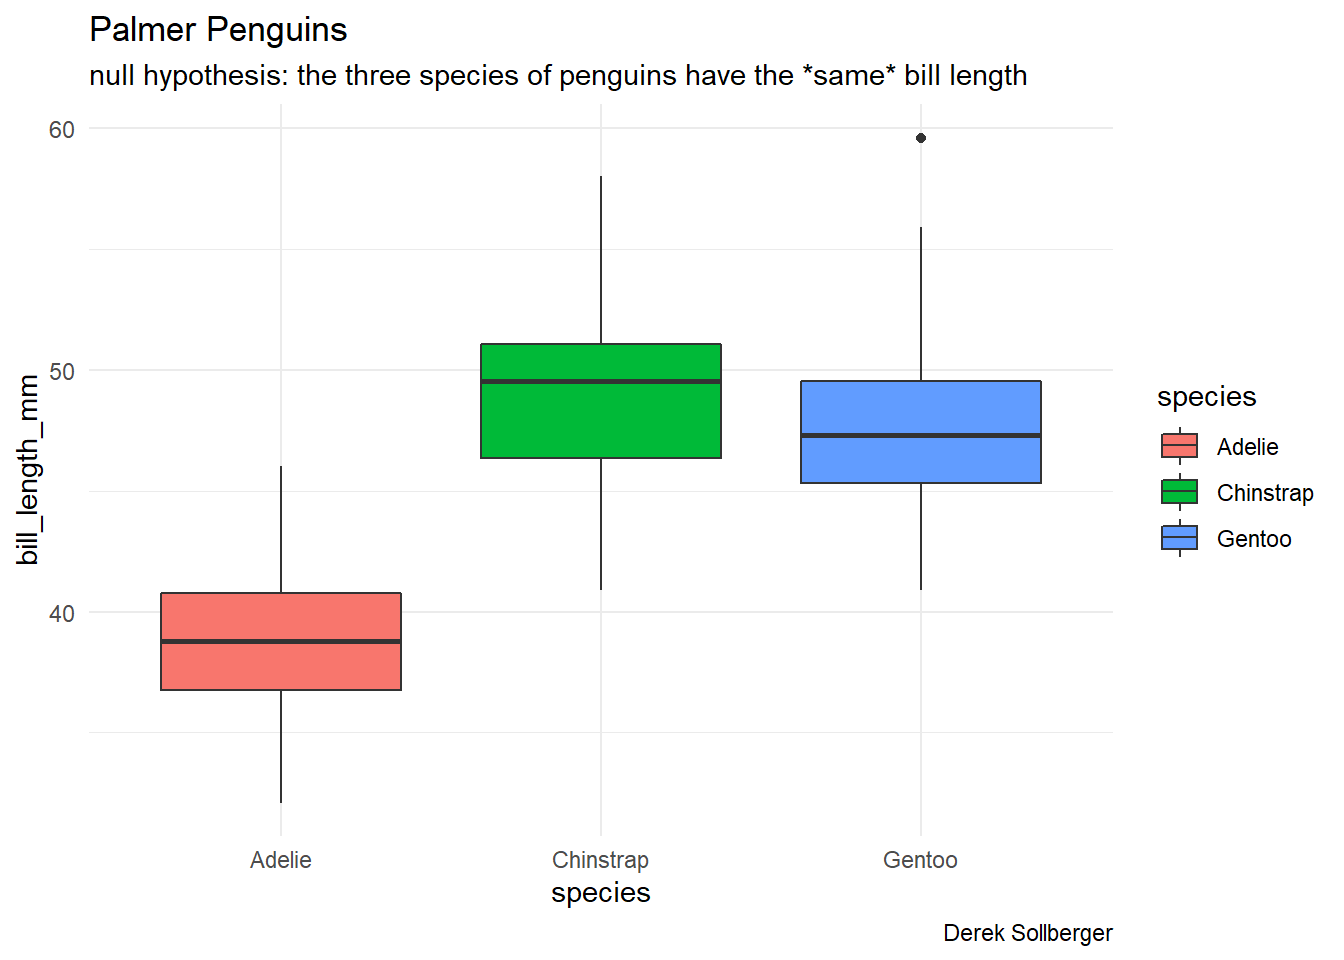
Visually, it appears that the penguins tend to have different bill lengths. To be more scientifically sound, let us now run the Kruskal-Wallis test.
# https://datasciencetut.com/how-to-perform-the-kruskal-wallis-test-in-r/
kruskal.test(bill_length_mm ~ species, data = penguins)
##
## Kruskal-Wallis rank sum test
##
## data: bill_length_mm by species
## Kruskal-Wallis chi-squared = 244.14, df = 2, p-value < 2.2e-16Since the p-value is less than 0.05, let us reject the null hypothesis of equal bill lengths.
===
The blog post mentioned above also told of a way to do pairwise comparisons in this setting (i.e. more than 2 labels)
pairwise.wilcox.test(penguins$bill_length_mm, penguins$species,
                     p.adjust.method = "BH")
##
## Pairwise comparisons using Wilcoxon rank sum test with continuity correction
##
## data: penguins$bill_length_mm and penguins$species
##
## Adelie Chinstrap
## Chinstrap <2e-16 -
## Gentoo <2e-16 0.0018
##
## P value adjustment method: BHIn this quick example, it appears that, pairwise, each species bill length is significally different than the other species.