| June 26, 2022
A colleague asked me about making an overlay map, and we discussed staring with the following information:
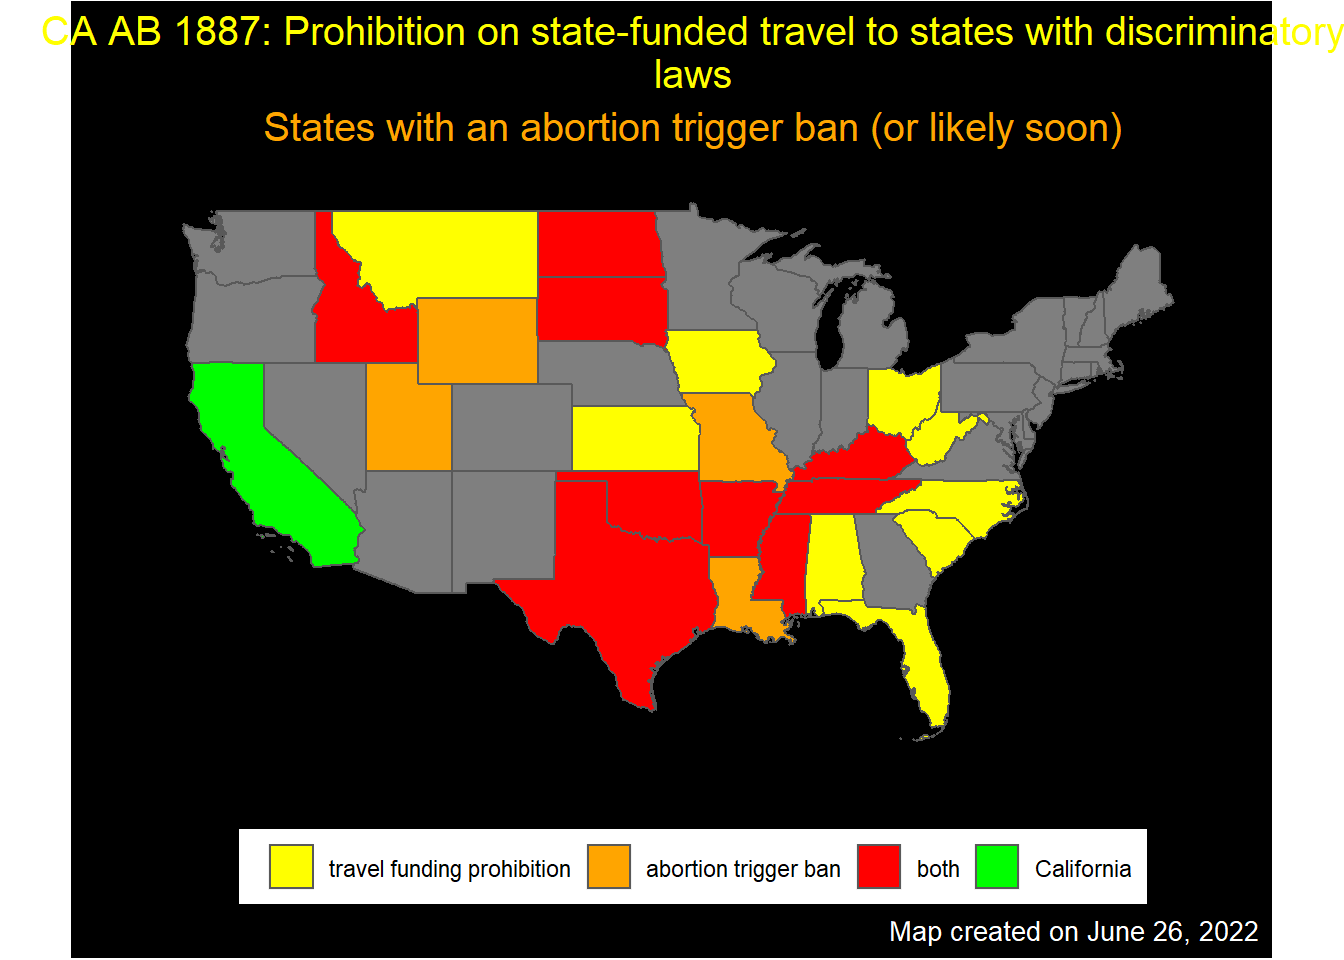
- US states where conference funding may be inhibited by AB 1887
- US states where trigger bans took (or are in process) effect when Roe v Wade was overturned
# load shape files
states_shp <- st_read("cb_2018_us_state_5m/cb_2018_us_state_5m.shp")
## Reading layer `cb_2018_us_state_5m' from data source
## `C:\Users\freex\Documents\GitHub\blogdown\content\blog\2022-06-26-abortion-trigger-bans\cb_2018_us_state_5m\cb_2018_us_state_5m.shp'
## using driver `ESRI Shapefile'
## Simple feature collection with 56 features and 9 fields
## Geometry type: MULTIPOLYGON
## Dimension: XY
## Bounding box: xmin: -179.1473 ymin: -14.55255 xmax: 179.7785 ymax: 71.35256
## Geodetic CRS: NAD83# load data file
# https://oag.ca.gov/ab1887
# https://www.guttmacher.org/article/2022/06/13-states-have-abortion-trigger-bans-heres-what-happens-when-roe-overturned
trigger_bans <- readxl::read_xlsx("trigger_bans.xlsx") |>
mutate(fill_color = case_when(
AB1887ban & trigger_ban ~ "both",
AB1887ban & !trigger_ban ~ "travel funding prohibition",
!AB1887ban & trigger_ban ~ "abortion trigger ban",
Region == "California" ~ "California",
TRUE ~ "gray50"
))states_shp |>
left_join(trigger_bans, by = c("NAME" = "Region")) |>
ggplot() +
geom_sf(aes(fill = fill_color)) +
scale_fill_manual(values = c("travel funding prohibition" = "yellow",
"abortion trigger ban" = "orange",
"both" = "red",
"California" = "green")) +
xlim(-125, -65) +
ylim(25, 50) +
theme(axis.text.x = element_blank(),
axis.text.y = element_blank(),
axis.ticks = element_blank(),
legend.position = "bottom",
legend.title = element_blank(),
panel.background = element_blank(),
panel.grid.major = element_blank(),
panel.grid.minor = element_blank(),
plot.background = element_rect(fill = "black"),
plot.title = element_text(color = "yellow", hjust = 0.5, size = 15),
plot.subtitle = element_text(color = "orange", hjust = 0.5, size = 15),
plot.caption = element_text(color = "white", hjust = 1.0, size = 10),
) +
labs(title = stringr::str_wrap("CA AB 1887: Prohibition on state-funded travel to states with discriminatory laws"),
subtitle = stringr::str_wrap("States with an abortion trigger ban (or likely soon)"),
caption = "Map created on June 26, 2022",
x = "", y = "")