Blog

Kruskal-Wallis Test

I want to mentally prepare for the upcoming semester. Today, let me do a warm-up exercise of computing a Kruskal-Wallis test. library("palmerpenguins") library("tidyverse") You can see that I will use the ubiquitous Palmer Penguins data set str(penguins) ## tibble [344 × 8] (S3: tbl_df/tbl/data.frame) ## $ species : Factor w/ 3 levels "Adelie","Chinstrap",..: 1 1 1 1 1 1 1 1 1 1 ... ## $ island : Factor w/ 3 levels "Biscoe","Dream",.

Continue reading

Deck of Cards

Years ago, I had to simulate a deck of playing cards in a Python course. Oddly enough, I don’t recall ever carrying out this task in R. Today, I saw a neat code snippet about the crossing() command in tidyr by Tan Ho in the R4DS Slack channel, so let us give it a try. library("tidyverse") suit <- c("D", "H", "C", "S") rank <- c(2:10, "J", "Q", "K", "A") deck <- tidyr::crossing(rank, suit) |> dplyr::mutate(card = paste0(rank, suit)) This yields a data frame with 3 columns: rank, suit, card.

Continue reading

Return to Mermaid Diagrams

I have been meaning to get back into making flow charts for a while. Over the years, I have tried different code packages, but I think that mermaid graphs make the most sense for my simple goals. library("DiagrammeR") For today’s practice, let us try to make a 2-by-2 decision tree. DiagrammeR::mermaid(" graph LR node1(start) node2{A} node3{not A} node4[B given A] node5[not B given A] node6[B given not A] node7[not B given not A] node1 --> node2 node1 --> node3 node2 --> node4 node2 --> node5 node3 --> node6 node3 --> node7 ") {"

Continue reading

Stardew Valley Expanded

Now that I finally have some free time, I want to play the Stardew Valley Expanded mod. But first, let us make a flow chart of the mods and their dependencies. library("DiagrammeR") my_plot <- DiagrammeR::mermaid(" graph LR SMAPI[SMAPI] Content_Patcher[Content Patcher] Custom_NPC_Exclusions[Custom NPC Exclusions] Expanded_Preconditions_Utility[Expanded Preconditions Utility] Extra_Map_Layers[Extra Map Layers] Farm_Type_Manager[Farm Type Manager] JSON_Assets[JSON Assets] SAAT[SAAT] Shop_Tile_Framework[Shop Tile Framework] Spacecore[Spacecore] Stardew_Valley_Expanded{Stardew Valley Expanded} SMAPI --> Content_Patcher SMAPI --> Custom_NPC_Exclusions SMAPI --> Expanded_Preconditions_Utility SMAPI --> Extra_Map_Layers SMAPI --> Farm_Type_Manager SMAPI --> JSON_Assets SMAPI --> Shop_Tile_Framework SMAPI --> Spacecore Content_Patcher --> Farm_Type_Manager Expanded_Preconditions_Utility --> JSON_Assets Expanded_Preconditions_Utility --> Shop_Tile_Framework Spacecore --> JSON_Assets SMAPI --> Stardew_Valley_Expanded Content_Patcher --> Stardew_Valley_Expanded Custom_NPC_Exclusions --> Stardew_Valley_Expanded Expanded_Preconditions_Utility --> Stardew_Valley_Expanded Extra_Map_Layers --> Stardew_Valley_Expanded Farm_Type_Manager --> Stardew_Valley_Expanded JSON_Assets --> Stardew_Valley_Expanded SAAT --> Stardew_Valley_Expanded Shop_Tile_Framework --> Stardew_Valley_Expanded Spacecore --> Stardew_Valley_Expanded ")

Continue reading

Extracting Tables from a PDF

Today I finally find myself needing to extract information from files delivered in the PDF format. I have heard good things about the tabulizer package, so we will try that out today. Whelp, it turned out that I needed to ensure a 64-bit installation of Java before I could install tabulizer. Also, I used remotes::install_github(...) command from [the package’s GitHub page[(https://github.com/ropensci/tabulizer)] to force the installation (as there appears to be issues with installing a package through CRAN where there are concerns of Java dependency).

Continue reading

Ridge Plots

library("ggridges") library("patchwork") library("tidyverse") # load data df <- readr::read_csv("BioSQuaRE_data.csv") # wrangling df$term <- factor(df$term, levels = c("Summer 2020","Fall 2020", "Spring 2021", "Fall 2021")) df_pre <- df |> filter(iter == "pre-test") df_post <- df |> filter(iter == "post-test") plot_pre <- df_pre |> ggplot(aes(x = Item, y = term, height = UCMer, group = term)) + geom_ridgeline(color = "#DAA900", fill = "#002856") + labs(title = "BioSQuaRE Results", subtitle = "pre-test", caption = "", x = "Test Question", y = "") + theme( axis.

Continue reading

Pascal's Triangle

Once again, I find that I have been nerd sniped (inspired by Mathigon). Today, I want to plot (and make an animation) for Pascal’s Triangle mod n. What I am thinking is store Pascal Triangle numbers along with row and column numbers in a data frame then assign x and y values rescale the x and y values to make an equilateral triangle # load package(s) library("tidyverse") # allocate data space N <- 50 #number of rows of wanted Pascal's Triangle # EDIT: my computer or software did not seem to handle larger numbers well row_total <- N*(N+1) / 2 #sum of 1 + 2 + .

Continue reading

Making Flash Cards

Today I wanted to try out the flashr package for making flash cards (i.e. see if this is something I want to pursue further). Someone (I am assuming his name is Jeffrey Stevens) over in the R4DS Slack channel mentioned a blog post using the flashr package. #devtools::install_github("JeffreyRStevens/flashr") library(flashr) From one of my 30 Day Map Challenge adventures, I had a data frame about availability of therapy in the United States.

Continue reading

Radically Infinite

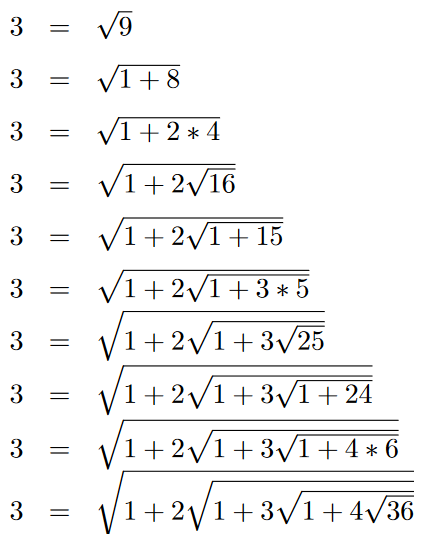
In today’s procrastination effort, I want to generate the LaTeX code to produce an infinite radical expansion for the number 3, and generate the code using R. … inspired by math teacher Chris Smith tweet First, let me see if I can simply generate the pattern of integers. I will use the letter capital “S” and later replace it with the square root symbol. stem <- "S 1 + " print(paste(stem, "8")) ## [1] "S 1 + 8" for(a in 2:5){ b <- (a+1)^2-1 print(paste(stem, a, "*", b/a)) print(paste(stem, a, "S", (b/a)^2)) print(paste(stem, a, "S", 1, "+", (b/a)^2- 1)) stem <- paste(stem, a, "S", 1, "+") } ## [1] "S 1 + 2 * 4" ## [1] "S 1 + 2 S 16" ## [1] "S 1 + 2 S 1 + 15" ## [1] "S 1 + 2 S 1 + 3 * 5" ## [1] "S 1 + 2 S 1 + 3 S 25" ## [1] "S 1 + 2 S 1 + 3 S 1 + 24" ## [1] "S 1 + 2 S 1 + 3 S 1 + 4 * 6" ## [1] "S 1 + 2 S 1 + 3 S 1 + 4 S 36" ## [1] "S 1 + 2 S 1 + 3 S 1 + 4 S 1 + 35" ## [1] "S 1 + 2 S 1 + 3 S 1 + 4 S 1 + 5 * 7" ## [1] "S 1 + 2 S 1 + 3 S 1 + 4 S 1 + 5 S 49" ## [1] "S 1 + 2 S 1 + 3 S 1 + 4 S 1 + 5 S 1 + 48" Not only do I need to now insert the square root symbol, but I would also need to close the parentheses.

Continue reading

Trying out the Flow package

I have been meaning to try out the flow package as it appears to help people visualize loops and conditional statements. Here is some code that I made to help someone over in the R4DS Slack channel. The task was to check if the change in temperature was over 0.5, and then to set the next 30 days of data to NA. temp_data <- rnorm(100, 20, 1) #fake data about temperatures N <- length(temp_data) #initialization buffer <- 0 day <- 2 previous_temp <- temp_data[1] # loop while(day <= N){ current_temp <- temp_data[day] if(buffer == 0){ if(!

Continue reading