| July 8, 2022
Once again, I find that I have been nerd sniped (inspired by Mathigon). Today, I want to plot (and make an animation) for Pascal’s Triangle mod n. What I am thinking is
- store Pascal Triangle numbers along with row and column numbers in a data frame
- then assign
xandyvalues - rescale the
xandyvalues to make an equilateral triangle
# load package(s)
library("tidyverse")
# allocate data space
N <- 50 #number of rows of wanted Pascal's Triangle
# EDIT: my computer or software did not seem to handle larger numbers well
row_total <- N*(N+1) / 2 #sum of 1 + 2 + ... + N
row_num <- rep(0, row_total)
col_num <- rep(0, row_total)
PT_val <- rep(0, row_total)
x <- rep(0, row_total)
y <- rep(0, row_total)
df <- data.frame(row_num, col_num, PT_val, x, y)Let us pretend we are back in our high school programming class and are asked to code up Pascal’s Triangle. [What’s missing here is all of my simple errors.]
# compute row and column numbers for data frame
m <- 1 #row counter in data frame
for(i in 1:N){
  for(j in 1:i){
    df$row_num[m] <- i
    df$col_num[m] <- j
    m <- m + 1
  }
}

# compute Pascal Triangle values
df$PT_val[df$row_num == 1 & df$col_num == 1] <- 1
df$PT_val[df$row_num == 2 & df$col_num == 1] <- 1
df$PT_val[df$row_num == 2 & df$col_num == 2] <- 1
for(i in 3:N){
  for(j in 1:i){
    if(j == 1){
      df$PT_val[df$row_num == i & df$col_num == j] <- 1
    } else if(j == i) {
      df$PT_val[df$row_num == i & df$col_num == j] <- 1
    } else {
      df$PT_val[df$row_num == i & df$col_num == j] <-
        df$PT_val[df$row_num == (i-1) & df$col_num == (j-1)] +
        df$PT_val[df$row_num == (i-1) & df$col_num == j]
    }
  }
}
The \(y\) values are easy. I simply need to reverse the order of the row numbers.
df$y <- N - df$row_num + 1There is probably a clever way of creating \(x\) values (toward a visual plot), but I am thinking of a brute force process
- row \(m\) has \(m\) non-zero Pascal’s Triangle numbers in it
- we can make a simple array 1, 2, …, \(m\) [actually, going to count by twos]
- then shift the array so that it is centered at \(x = 0\)
for(i in 1:N){
  these_x_vals <- seq(1, 2*i, 2) - i
  for(j in 1:i){
    df$x[df$row_num == i & df$col_num == j] <- these_x_vals[j]
  }
}
I want my graphs to make an equilateral triangle, so I need to rescale the \(x\) values by a factor of
\[\frac{1}{2} \div \frac{\sqrt{3}}{2} = \frac{1}{2} * \frac{2}{\sqrt{3}} = \frac{1}{\sqrt{3}}\]
df$x <- df$x / sqrt(3)Let’s make a graph!
df |>
  ggplot() +
  geom_point(aes(x = x, y = y)) +
  coord_equal() #ensuring equal scales for x and y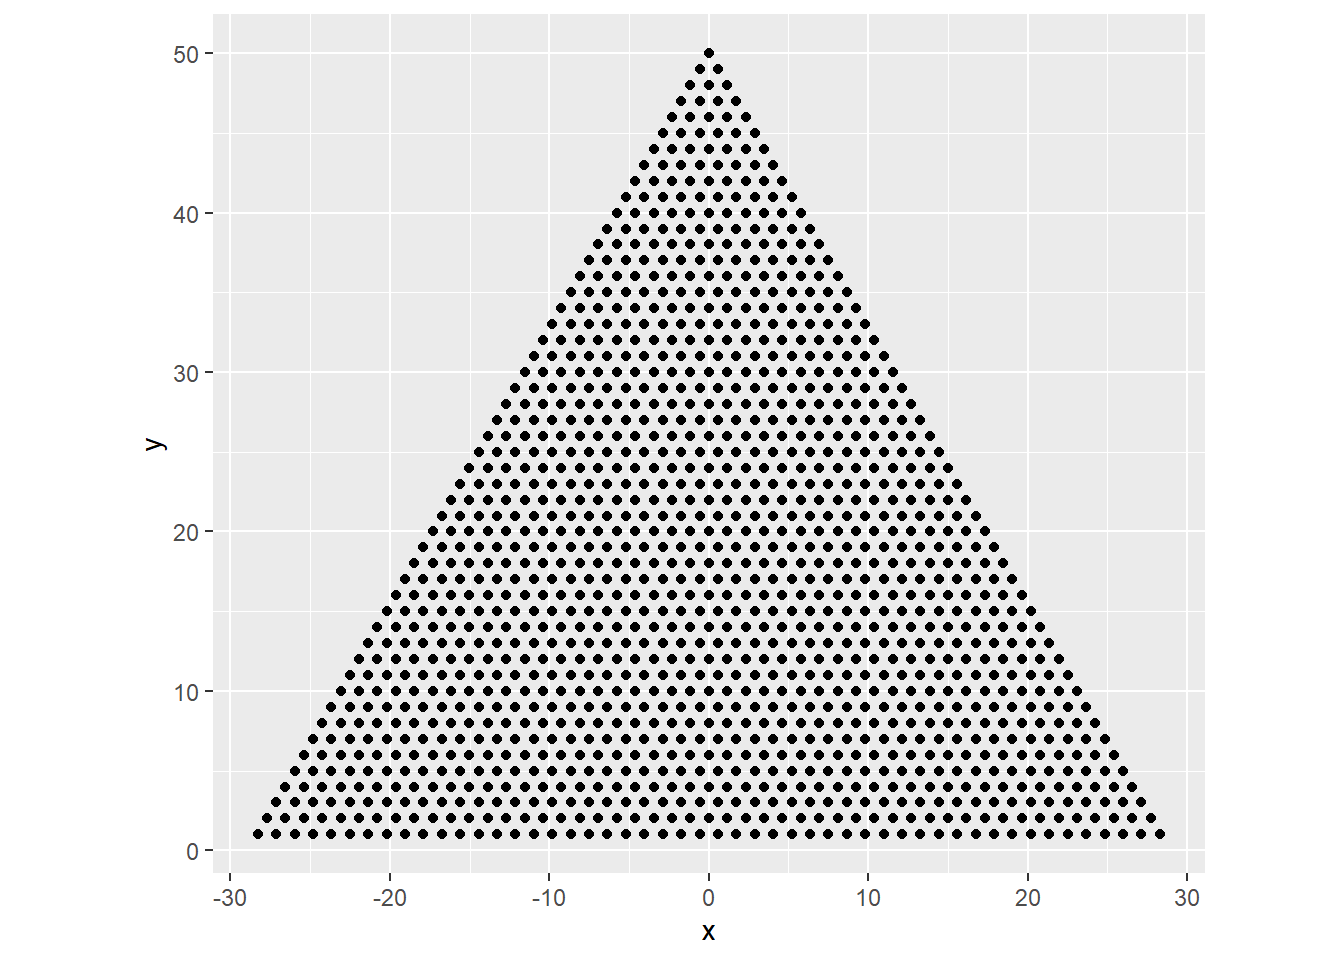
Now for the nerdy part! We can compute the Pascal Triangle numbers modulo \(n\) for some natural number \(n\), and the truly divisible numbers create fractal patterns.
n <- 2
df |>
  ggplot() +
  geom_point(aes(x = x, y = y,
                 color = (PT_val %% n) == 0),
             size = 5) +
  coord_equal() +
  labs(title = "Pascal's Triangle",
       subtitle = paste("divisible by", n),
       caption = "Derek Sollberger") +
  scale_color_manual(values = c("gray90", "#D60270")) +
  theme(axis.line = element_blank(),
        axis.text = element_blank(),
        axis.ticks = element_blank(),
        axis.title = element_blank(),
        legend.position = "none",
        panel.background = element_blank(),
        plot.title = element_text(face = "bold", size = 20,
                                  color = "#0038A8", hjust = 0.5),
        plot.subtitle = element_text(size = 15,
                                     color = "#D60270", hjust = 0.5),
        plot.caption = element_text(size = 10,
                                    color = "#0038A8", hjust = 0.5))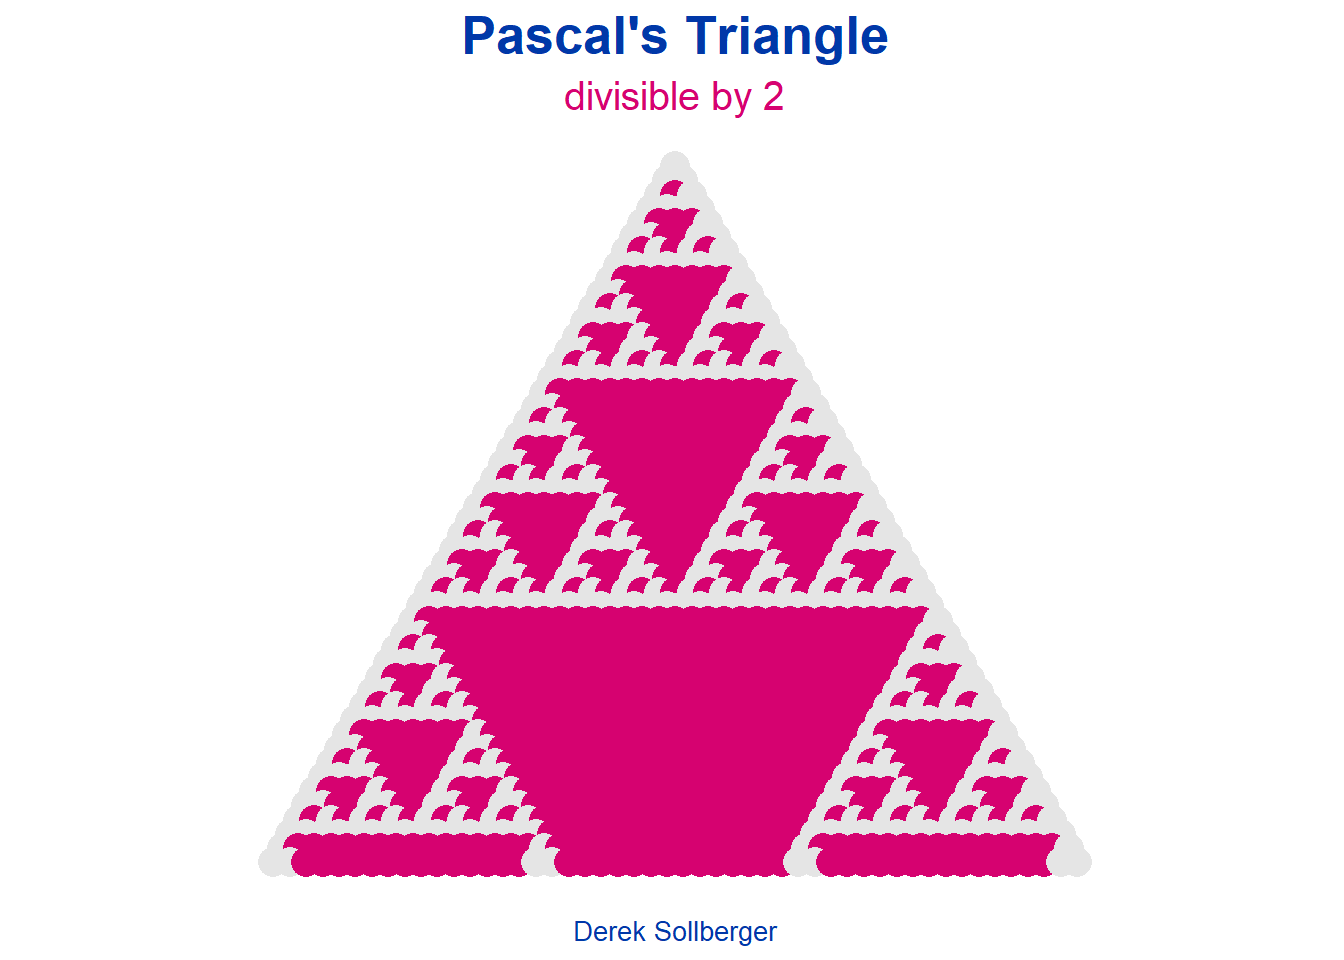
To make an animation, I tend to elect to make several images, and then use a 3rd-party app to combine the images.
for(n in 2:20){
  this_plot <- df |>
    ggplot() +
    geom_point(aes(x = x, y = y,
                   color = (PT_val %% n) == 0),
               size = 1) +
    coord_equal() +
    labs(title = "Pascal's Triangle",
         subtitle = paste("divisible by", n),
         caption = "Derek Sollberger") +
    scale_color_manual(values = c("gray75", "#D60270")) +
    theme(axis.line = element_blank(),
          axis.text = element_blank(),
          axis.ticks = element_blank(),
          axis.title = element_blank(),
          legend.position = "none",
          panel.background = element_blank(),
          plot.title = element_text(face = "bold", size = 15,
                                    color = "#0038A8", hjust = 0.5),
          plot.subtitle = element_text(size = 15,
                                       color = "#D60270", hjust = 0.5),
          plot.caption = element_text(size = 10,
                                      color = "#0038A8", hjust = 0.5))

  # save this plot
  ggsave(paste0("pascal_plot_", n, ".png"), plot = this_plot,
         device = "png", height = 800, width = 1200,
         dpi = 300, units = "px")
}